Warehouse automation is no longer a futuristic warehouse feature. It is a capital decision with visible consequences. A shuttle system, robotic picking arm, or autonomous mobile robot must improve throughput without creating a costly bottleneck.
MHI’s 2024 Annual Industry Report found that 55% of supply chain professionals were increasing investment in technology and innovation. The report also identified robotics, automation, and predictive analytics as major priorities. Deloitte’s 2024 Smart Manufacturing and Operations Survey reported that many manufacturers still struggle to convert digital investment into measurable financial returns. The lesson is uncomfortable. Buying equipment is not the same as creating value.
As warehouse automation expert Jeff Burnstein, president of the Association for Advancing Automation, has said, “Automation is not about replacing people; it’s about helping people do their jobs better.” That principle supports a practical approach to how to maximize roi from warehouse automation investments. The strongest projects connect labor savings, order accuracy, inventory velocity, and customer service.
The numbers need discipline. A robot may reduce walking time, yet maintenance, software, integration, training, and downtime can weaken the business case. A faster conveyor may expose poor slotting or unreliable data. Real warehouses are messier than spreadsheets.
This guide presents seven practical tips for improving automation ROI. It focuses on baseline measurement, process readiness, scalable technology, workforce adoption, and continuous performance reviews. Some assumptions may fail. That is useful. A credible investment model should reveal uncertainty before the purchase order is signed.
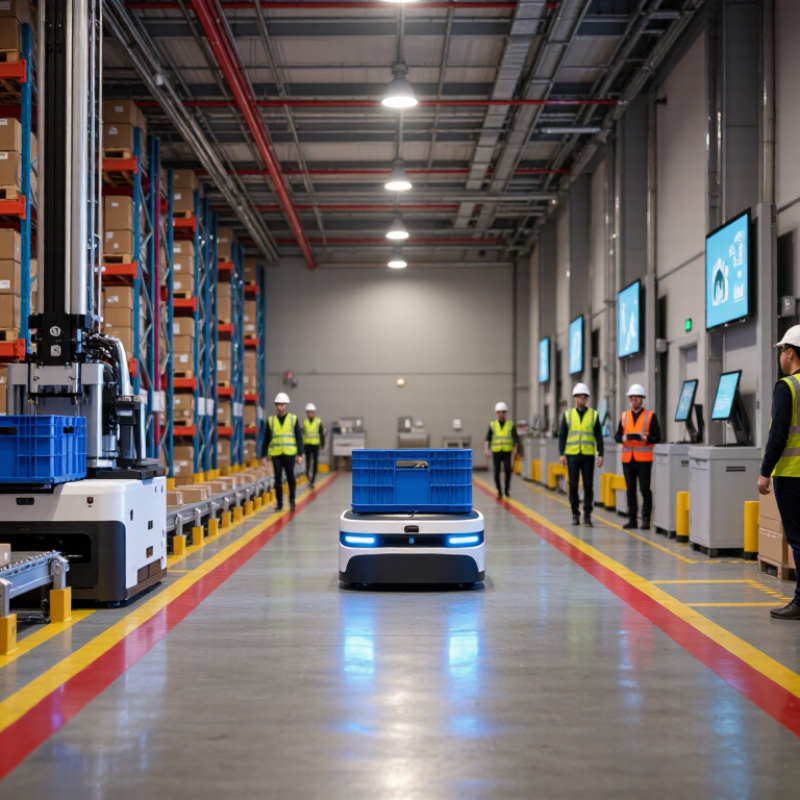
Before buying equipment, assess the warehouse as it operates today.
Walk each process, from receiving docks to final dispatch. Record travel distance, waiting time, touches, errors, and peak-hour congestion. Measure the baseline first.
Separate urgent problems from impressive ideas. The 2024 MHI Annual Industry Report found that 55% of supply-chain leaders planned to increase technology investment. That pressure can encourage rushed decisions.
Set measurable goals instead, such as reducing picking time by 20%, improving inventory accuracy to 99%, or cutting overtime hours by 15%.
Use real order history, not average-day assumptions. Include seasonal spikes, damaged goods, training time, maintenance, integration costs, and floor-space changes. Define the payback period before requesting proposals.
Start small. A limited pilot can test throughput, worker safety, exception handling, and data quality. Measure results against the baseline for several weeks. Review both financial and operational outcomes.
A system may raise productivity while creating new bottlenecks at packing stations. That is easy to miss.
Recalculate ROI using actual pilot data. If the target moves, document why. Honest revisions are more valuable than attractive forecasts.
Sources: MHI, 2024 Annual Industry Report; WERC, 2024 DC Measures Report.
Automation decisions should begin with a measured baseline, not an attractive payback promise. Record orders per hour, labor hours, picking errors, overtime, and equipment downtime. Walk the warehouse during peak periods. The quiet morning shift can hide serious capacity problems. Small omissions matter.
Calculate total costs across the full project life. Include equipment, software, integration, training, maintenance, energy, safety checks, and temporary downtime. Add a realistic contingency for layout changes and delayed commissioning. Then estimate savings from fewer errors, lower overtime, faster picking, and better space use. For example, if annual savings reach $180,000 and five-year costs total $620,000, the simple ROI is about 45%. Use this formula: total net benefit divided by total investment.
Test several scenarios before approving the project. Model lower order growth, higher maintenance costs, and slower employee adoption. Expected savings are rarely exact. Our first estimate once excluded retraining time, and the projected payback shifted by several months. That mistake was useful. It showed why finance, operations, maintenance, and warehouse staff should review the assumptions together. Track monthly results after launch, including throughput, error rates, labor hours, energy use, and unplanned stops. Compare actual performance with the original model. Refresh the ROI calculation every quarter. A system can produce strong savings initially, then lose value when maintenance or process discipline declines.
7 Tips to Maxize ROI from Warehouse Automation
Choose Scalable Technologies That Fit Daily Operations
Warehouse automation should match the work already happening on the floor. A fast-moving picking area needs different tools from a temperature-controlled storage zone. Start with one measurable bottleneck, such as repeated walking between shelving and packing stations. MHI’s 2024 Annual Industry Report found that 55% of supply chain leaders planned to increase technology investment. That spending still needs discipline.
Scalable technology grows with order volume, product variety, and staffing changes. Modular conveyors, mobile robots, and software with open integrations can support gradual expansion. Operators should test systems during normal shifts, not only during controlled demonstrations. Watch scan errors, replenishment delays, battery changes, and worker acceptance. Small details often decide whether projected savings become real savings.
Keep the interface simple. DHL’s 2024 Logistics Trend Radar reports that 73% of supply chain professionals expect artificial intelligence to improve logistics operations. Yet advanced analytics cannot repair inaccurate inventory data. Not glamorous. A poorly planned pilot can increase congestion instead of reducing it. That risk deserves attention.
A practical rollout may begin with one aisle, one shift, and one clear baseline. Measure throughput, labor hours, downtime, maintenance costs, and order accuracy before expanding. Review the results with warehouse employees, because they notice awkward handoffs first. The cheapest system is not always the best investment. The right system should remain useful when daily conditions become unpredictable.
Choose scalable technologies that fit daily operations. This planning benchmark estimates labor hours saved per 100,000 order lines when automation is matched to repetitive warehouse tasks. Results are based on stated operating assumptions and should be validated with site-specific data before investment.
Planning assumptions: 100,000 order lines per month, 45 seconds of manual labor per line, 80% usable automation coverage, and 85% effective uptime. Source basis: customer-order-line productivity modeling using standard warehouse process assumptions.
Prepare Employees and Integrate Automation with Existing Systems
Warehouse automation creates value only when employees understand how and why it works. Map current workflows before selecting equipment or software. Walk the warehouse with operators. Their practical knowledge often reveals delays that reports miss. Involve them early, and record their concerns without dismissing them. Our first training plan was too technical. We learned that short, task-based sessions worked better. Let employees practice scanning, exception handling, and safe equipment shutdowns. Use realistic orders, damaged cartons, and sudden system alerts.
Integration requires equal attention. Connect automation with existing inventory, order, and workforce systems through documented data rules. Define which system owns each record. Test common failures, including duplicate orders, missing labels, and network interruptions. Keep a manual process available. It may feel inefficient, but it protects operations during uncertain moments. Run a limited pilot in one zone before expanding. Measure picking accuracy, order cycle time, training completion, and unplanned stops.
Listen carefully.
Hold weekly reviews with supervisors and technicians. Compare system reports with what workers actually experience. A dashboard may show higher throughput while employees face more repetitive strain. That gap needs investigation. Adjust task design, staffing, and training based on evidence. Document every change, including unsuccessful trials. Reliable improvement depends on honest records, clear ownership, and employees who can challenge the process safely.
Tip 1: Track performance beyond headline throughput. Measure orders per hour, order accuracy, downtime, labor hours per order, and exception rates. I have seen fast systems hide rising rework costs. Review these figures by shift, zone, and product type. Short daily checks reveal patterns that monthly reports miss.
Tip 2: Optimize the process around the technology. Walk the operation during peak periods and watch where cartons pause, workers wait, or scanners fail. A crowded replenishment lane can reduce output more than slow equipment. Adjust slotting, pick paths, and task sequences before buying additional capacity. Small changes often deliver faster returns. Still, clean data is essential. Poor item dimensions can make a good analysis unreliable.
Tip 3: Expand only what has proved dependable. Start with one product zone, define a baseline, and compare results for several weeks. Include maintenance time, training effort, energy use, and safety observations in the business case. A pilot may show impressive speed but weak flexibility. That is useful evidence, not failure. Document the conditions that produced success, then repeat the solution in similar zones. Keep a manual fallback for unusual orders and system interruptions. This protects service levels while the operation learns.
Practical performance measures and realistic improvement ranges for evaluating warehouse automation investments
| Tip | Primary Performance Dimension | Key KPI to Track | Typical Baseline | Realistic Improvement Target | Expected Operational Impact | Review Cadence | Priority |
|---|---|---|---|---|---|---|---|
| 1 Establish a measurable baseline | Before-and-after performance visibility | Cost per order line Order cycle time Labor hours per unit |
Measured for at least 4–8 weeks before deployment | 100% KPI coverage for the automated process, with agreed definitions and data ownership | Creates a reliable basis for calculating payback, labor savings, throughput gains, and service improvements | Weekly during implementation; monthly after stabilization | High |
| 2 Track throughput and bottlenecks | Capacity utilization and flow efficiency | Lines picked per labor hour Units per hour Queue time |
Manual picking often ranges from approximately 60–120 lines per labor hour, depending on SKU profile and travel distance | 15–35% higher throughput after slotting, routing, and automation settings are optimized | Higher capacity without proportional labor growth; earlier detection of congestion and underused equipment | Daily dashboard review; weekly root-cause analysis | High |
| 3 Optimize inventory accuracy | Stock reliability and order availability | Inventory record accuracy Short-pick rate Cycle-count variance |
Many warehouses operate around 95–98% inventory accuracy before tighter controls are introduced | 98.5–99.5% accuracy through barcode validation, location controls, and scheduled cycle counting | Fewer stockouts, substitutions, expedited replenishment tasks, and customer service exceptions | Daily exception monitoring; monthly cycle-count audit | High |
| 4 Reduce travel and handling waste | Movement efficiency and ergonomic workload | Travel distance per order Touches per unit Replenishment frequency |
Travel and repeated handling can account for roughly 40–60% of picker activity in conventional piece-picking operations | 20–40% reduction in travel distance or unnecessary touches through slotting and goods-to-person workflows | Lower labor content per order, reduced fatigue, and greater usable capacity during peak periods | Weekly analysis by zone, shift, and order profile | Medium |
| 5 Improve order accuracy and service quality | Customer fulfillment quality | Order accuracy rate Perfect-order rate Returns caused by warehouse error |
Order accuracy commonly ranges from 97–99% before additional verification and process controls | 99.5% or higher order accuracy with scan validation, exception workflows, and quality checks | Fewer returns, credits, reshipments, complaints, and avoidable transportation costs | Daily exception review; monthly customer-impact report | High |
| 6 Use predictive maintenance and uptime data | Asset availability and maintenance cost | System availability Mean time between failures Mean time to repair |
Well-maintained automated systems often target approximately 98–99.5% operational availability, depending on system design | 10–25% fewer unplanned stoppages through condition monitoring, spare-parts planning, and preventive maintenance | More consistent throughput, lower emergency repair costs, and improved labor planning | Real-time alerts; weekly maintenance review; monthly reliability report | High |
| 7 Scale only proven solutions | Investment return and expansion readiness | Payback period Return on invested capital Cost per processed unit |
Automation payback periods frequently vary from approximately 2–5 years, depending on labor costs, utilization, and project scope | 10–20% lower unit-processing cost in validated expansion areas, with a documented business case | Limits capital risk and allows high-performing workflows to be replicated across zones or facilities | Monthly financial review; quarterly scale-up decision | Standard |
Data note: The ranges shown are practical industry benchmark ranges and planning targets. Actual results depend on SKU characteristics, order profiles, labor rates, layout, automation type, utilization, integration quality, and operating discipline.
Record travel distance, waiting time, manual touches, errors, and peak-hour congestion. Measure the current baseline.
Use measurable targets, such as reducing picking time by 20%. Other goals include 99% inventory accuracy or 15% fewer overtime hours.
Average days can hide seasonal spikes and peak-hour pressure. Include damaged goods, training time, maintenance, and changing floor space.
A pilot tests throughput, safety, exception handling, and data quality. Run it in one zone for several weeks.Start small.
Include equipment, software, integration, training, maintenance, energy, safety checks, and temporary downtime.
Divide total net benefit by total investment. For example, $180,000 in annual savings and $620,000 in five-year costs produce about 45% simple ROI.
Model slower order growth, higher maintenance costs, and delayed employee adoption. Expected savings are rarely exact.Our estimate missed retraining time.
Provide short, task-based practice with scanners, damaged cartons, system alerts, and safe shutdown procedures. Avoid overly technical training.
Test duplicate orders, missing labels, network interruptions, and unclear data ownership. Keep a manual process available during uncertain moments.
Review throughput, accuracy, labor hours, energy use, training completion, and unplanned stops each month. Recalculate ROI quarterly.That gap matters.
Maximizing warehouse automation returns starts with a clear understanding of operational needs, bottlenecks, order volumes, and workforce capabilities. Set measurable goals such as faster processing, lower error rates, reduced labor costs, or improved order accuracy. Before investing, calculate the full cost of equipment, software, training, maintenance, integration, and future upgrades, then compare these expenses with realistic short- and long-term savings. This financial analysis helps teams understand how to maximize roi from warehouse automation investments without overlooking hidden costs.
Select scalable technologies that match daily workflows and can grow with changing business demands. Prepare employees through practical training and involve them in the transition so automation supports, rather than disrupts, existing operations. Smooth integration with current systems is also essential for reliable data and coordinated processes. After implementation, track performance using consistent metrics, identify inefficiencies, and refine workflows regularly. Successful solutions can then be expanded gradually, allowing the warehouse to improve productivity while controlling risk and maintaining sustainable returns.

JK Logistics